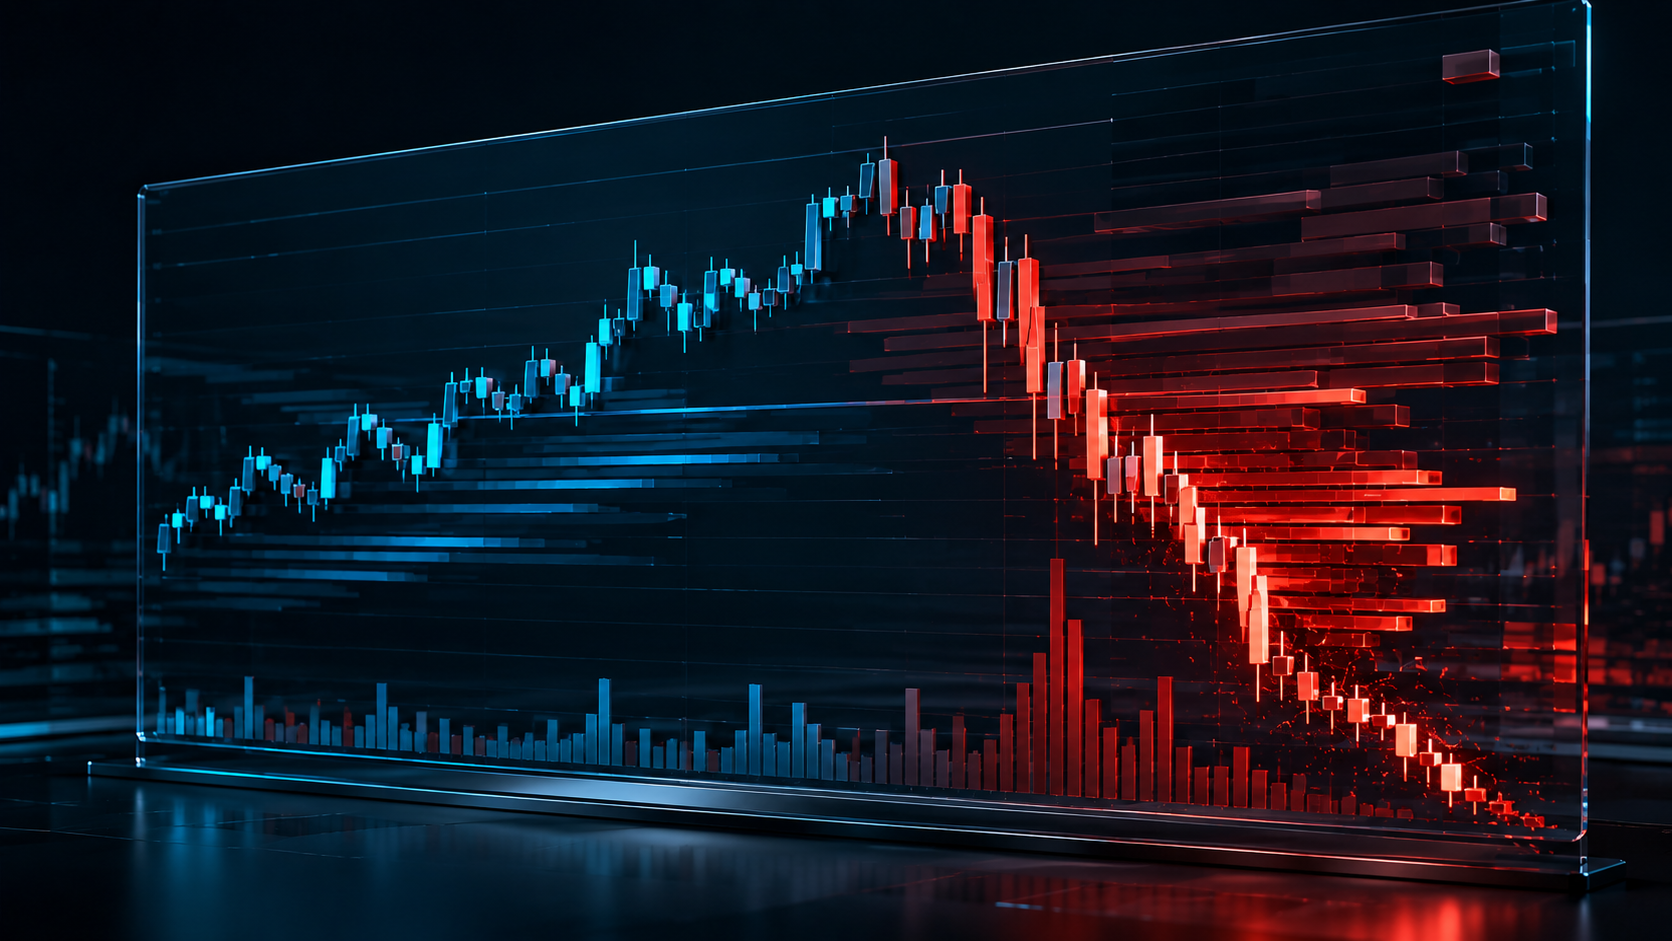
Trading drawdown should be measured as the distance from the previous capital peak, not merely as the sum of losses from recent trades. If an account has fallen by 20% from its peak, returning to the starting point requires a 25% gain on the remaining capital. The deeper the decline, the more sharply the required return increases.
Practical control rests on three things: a consistently calculated equity curve, risk thresholds defined before losses occur, and clear conditions for restoring risk. Risk should not be increased merely to recover the account more quickly. When a warning threshold is reached, the strategy, execution and total exposure should be reviewed first. If the capital safety limit is reached, live trading should be halted in accordance with a written plan prepared in advance.
What exactly is drawdown?
A decline in capital, or drawdown, is a reduction—measured as a percentage or monetary amount—from the highest capital value reached up to that point to a lower current or subsequently reached value. The previous peak is often called the high-water mark.
Three figures are needed for the calculation:
- peak capital — the highest correctly recorded account value up to a given point;
- current drawdown — the decline from that peak to the current value;
- maximum drawdown — the largest peak-to-trough decline over the entire period analysed.
You must also define what “capital” means. The account balance includes only the results of closed trades, while account equity also includes unrealised profits or losses on open positions. If the aim is to control actual risk, the equity curve is usually more informative. A balance curve can conceal a large temporary decline in an open position.
The chosen method must not be changed according to which one looks better on a particular day. Strategies should be compared using the same data frequency, the same treatment of costs and the same approach to open positions.
How to calculate current and maximum drawdown
If the previous capital peak is P and current capital is E, then:
Drawdown = (P − E) / P × 100%
For example, if the account peak was 20,000 euros and current equity is 16,000 euros:
(20 000 − 16 000) / 20 000 × 100% = 20%
The decline is 4,000 euros in monetary terms and 20% in percentage terms. Both measures are useful: the percentage allows accounts of different sizes to be compared, while the amount shows the actual capital separating the current position from the peak.
To determine maximum drawdown, take two actions at every point on the equity curve:
- retain the highest capital value reached up to that point;
- calculate the decline at that point from the retained peak.
The largest resulting value is the maximum drawdown over the period analysed. In addition to depth, record the drawdown duration—the time from the previous peak until capital reaches it again. If the peak has not yet been recovered, the drawdown is ongoing and its duration should not be reported as a completed period.
Deposits and withdrawals can distort the calculation. An additional deposit is not strategy profit, while a withdrawal is not a trading loss. In practice, you can use a broker’s or record-keeping system’s capital return report that separates external cash flows, or construct a normalised strategy index. The key is to prevent a deposit from artificially creating a new “profit peak”.
Why loss and recovery percentages differ
Recovery begins from a smaller capital base. If the loss relative to the previous peak is L in decimal form, the required gain on the remaining capital is:
Return required for recovery = L / (1 − L) × 100%
|
Drawdown from peak |
Gain required to regain peak |
|
5% |
5.26% |
|
10% |
11.11% |
|
20% |
25% |
|
30% |
42.86% |
|
40% |
66.67% |
|
50% |
100% |
This asymmetry is why preserving capital becomes increasingly important as drawdown deepens. After a 50% decline, a 50% gain is not enough—the remaining capital must double.
The formula gives the required return, but it does not predict how many trades or how much time recovery will take. That cannot be determined properly without assumptions about the strategy’s expected performance, the dispersion of its results, costs and market conditions. Even a positive historical average return does not guarantee a specific recovery period.
Practical example: how position size changes risk
Suppose the account peak was 20,000 euros, but only 16,000 euros remained after a series of losses. The decline from the peak is 20%, and a 25% gain is required to regain it.
If a planned loss at the stop-loss level was 0.5% of current capital, the amount at risk would now be 80 euros. If the trader continued to risk the previously fixed amount of 100 euros, that same amount would represent 0.625% of current capital. A constant monetary amount therefore automatically increases percentage risk after a decline.
Planned risk is not limited to the distance to the stop-loss level. In simplified terms, it is the number of position units multiplied by the difference between the entry and stop prices, plus commission and a reasonable allowance for execution slippage. For derivatives, the contract multiplier must also be considered. A stop price alone does not guarantee execution at precisely that price, especially during a fast-moving market or periods of low liquidity.
When to reduce risk because of drawdown
There is no universal drawdown percentage at which every trader should reduce risk. An appropriate limit depends on the dispersion of the strategy’s results, leverage, the instrument, correlation between positions, costs and the amount of capital the trader can afford to lose.
The decision framework can be divided into three states.
Normal mode
In this mode, drawdown remains below the predefined warning threshold, execution metrics have not deviated materially from the strategy’s test parameters, and no process errors have been identified. The standard risk per trade and total exposure limit defined in the plan are used.
Reduced-risk mode
This mode begins when the warning threshold is reached or when a problem that increases uncertainty is identified. For example, risk might be reduced to 50% of the normal level, but this figure is illustrative only—the actual multiplier must be defined in the strategy’s risk plan.
Reducing risk may also be justified before the drawdown threshold is reached if:
- actual execution slippage or commissions have become materially higher than those used in testing;
- positions open at the same time create exposure to the same market factor;
- entry, stop-loss or position-sizing rules have been breached;
- the instrument’s liquidity or volatility, or the broker’s margin conditions, have changed;
- there are insufficient data to determine whether the losses fall within the strategy’s normal dispersion.
Reduced risk slows potential recovery while also limiting the effect of the next loss. It does not guarantee a return to the peak. It can provide time for review and limit further damage to capital.
Halt mode
Live trading should be halted if the predefined capital safety limit has been reached, a technical or accounting error has been identified, the strategy is being used outside its intended market conditions, or the trader repeatedly fails to follow the process. Halting is not a prediction that the next trade will lose. It is a control mechanism for a situation in which the assumptions are no longer sufficiently reliable.
How to set your own drawdown thresholds
First, define the absolute capital floor F, below which the account must not fall. If the peak is P, the maximum permissible decline to that floor is:
(P − F) / P × 100%
This limit should be based on the trader’s financial circumstances and the instrument’s requirements, not on a desire to recover losses quickly. Capital needed for everyday expenses or an emergency reserve is not suitable for speculative risk.
Next, place a warning threshold between normal mode and the absolute limit. It can be informed by the strategy’s backtest, out-of-sample testing and forward-test results, but historical maximum drawdown is not a reliable future boundary. A short data history, overfitting and excessively optimistic cost assumptions can make the estimate misleading. An uncertainty margin is therefore required, together with a threshold more conservative than the theoretical maximum decline the capital could tolerate.
Write down a specific action for each threshold:
|
State |
Mandatory action |
Condition for returning |
|
Normal |
Follow the standard risk and exposure limits |
No conditions have been breached |
|
Warning |
Reduce risk and review trades and execution |
Review completed and deviations explained |
|
Halt |
Do not open new live trades |
Cause resolved and retesting completed |
A return to full-risk mode should not be justified by only a few profitable trades. A process-based criterion is required: accurate data, resolution of the technical problem, verification of the strategy logic, and a predefined observation period at reduced risk or in simulation. Otherwise, the modes become an emotional switch.
What to review when drawdown increases
The review should distinguish between three possible causes.
Strategy dispersion. Losses may represent a possible, though unpleasant, sequence within the system’s range of outcomes. Assess the total drawdown and the distribution of trades by setup, market regime and instrument.
Execution degradation. Results may be worsened by late entries, slippage, commissions, incorrect position sizing or moving the stop-loss level. In this case, the problem does not necessarily lie in the strategy’s underlying idea.
Structural change. The strategy’s assumptions may no longer match market volatility, liquidity or price behaviour. This cannot be established from a single series of losses, but nor should it be assumed automatically that the historical edge will inevitably return.
During the audit, use the trading journal, the broker’s execution data and the original strategy rules. If the rules were never written down, it is impossible to distinguish reliably between system drawdown and the results of improvised decisions.
Common mistakes during recovery
The most dangerous mistake is increasing position size solely because a particular amount “must be won back”. The market has no obligation to respect the account’s previous peak, and a recovery target does not improve the quality of the next trade.
Other common mistakes include:
- measuring drawdown only from the closed balance while ignoring open losses;
- treating an additional deposit as a recovery in the equity curve;
- reducing risk based on instinct without predefined criteria for restoring it;
- treating several correlated positions as independent trades;
- regarding historical maximum drawdown as a guaranteed future limit;
- equating the amount at the stop-loss level with the maximum possible loss without considering execution and price-gap risk.
Changing modes too frequently can also be harmful. If risk is increased after every small profit and reduced after every loss, position size begins to follow short-term noise. Thresholds must be sufficiently clear to be applied consistently.
Limitations and risks
Drawdown is a backward-looking measure. It describes what has happened, but does not by itself determine the probability of the next trade or prove whether the strategy’s edge remains intact. Historical maximum drawdown is particularly sensitive to the length of the period analysed and the quality of the selected data.
With leveraged instruments, the account’s safety limit may be reached faster than an end-of-day calculation suggests. Margin requirements, forced position closures, price gaps and insufficient liquidity may limit the ability to execute the plan. FINRA rules apply in the context of the US securities market, while ESMA material covers European Union retail-client protection measures for CFD trading. Always check the broker agreement and the requirements of the jurisdiction applicable to the specific account.
This article is educational and does not constitute individual investment advice. No drawdown control method guarantees profit, capital recovery or protection against a loss exceeding the planned amount.
Short checklist
Before the next trade, check:
- whether drawdown has been calculated from equity using a consistent method;
- whether deposits and withdrawals have been separated from trading results;
- how much return is required to regain the previous peak;
- the current risk per trade and total open exposure;
- which risk mode is currently in effect;
- the precise action required when the next threshold is reached;
- what evidence will be required to restore risk.
Conclusion
Drawdown control is not an attempt to predict the exact bottom of the equity curve. Its purpose is to prevent the desire to return quickly to the peak from replacing decision rules during periods of loss. An accurate calculation shows the scale of the problem, while predefined modes determine the response: continue, reduce risk, or halt live trading and review the system.